
Argentina has been “printing money for the people” MMT-style for many years. Its wrongly-called “inclusive monetary policy” of the past -print money to finance massive government spending- has driven the country to massive inflation and depression.
Argentina has been “printing money for the people” MMT-style for many years. Its wrongly-called “inclusive monetary policy” of the past -print money to finance massive government spending- has driven the country to massive inflation and depression.
In this fourth episode of my video blog, I explain the economic slowdown, why central banks are not understanding the key global trends and what they mean for inflation, growth and productivity.
Do not miss the other episodes. Thanks for watching!!
Third Episode of my video-blog World Economics. Thanks for the success of the other episodes. This month we speak of the global slowdown and the poisoned solution of more stimuli and “a new deal”

What happens when politicians see that their monster stimuli have not delivered? They bring the next rabbit out of a hat. They need a new name and a new magic solution to make citizens believe in the magic of demand-side policies despite the constant failure of those same plans. Read More
Talking in CNBC about the 2019 outlook
The central idea is that we are in the process of a change of cycle that central banks and governments are unlikely to disguise because both monetary tools and fiscal space have been exhausted. This change of cycle may not lead to a 2008-style recession, but more likely to a Japanese-style stagnation as debt continues to rise while economic and productivity growth weaken. As such, we as investors may believe the mirage of a chain of “bullish” headlines in the first part of 2019: a trade deal between the U.S. and China (likely), a large China stimulus (very likely) and central banks’ relative dovishness (highly likely). This may create short-term bounces, but the euphoria effect many quickly fade because even with a bounce in global liquidity, net financing needs may exceed real growth. If markets react quickly and aggressively to these “false” bullish signals increasing risk and leverage, the probability of falling into a 2008-style crisis increases. Liquidity is falling, and this may reduce this risk of abnormal bullishness.
Qatar withdrawal from #OPEC is a monumental event that signals the likely end of the cartel. Watch my interview at @WIONews India
The G20 meeting in Buenos Aires had a primary objective. To reach an agreement between the United States and China.
However, the announced agreement is more a “diplomatic truce” than a real agreement.
The United States commits to delaying tariffs against China that would start on January 1st, 2019 and China commits to purchase more agricultural and energy products (LNG, liquefied natural gas) in addition to promising to advance in legal security, compliance with contracts, the opening of capital markets and protection of intellectual property.
However, the wording is vague, the commitments are conditional and the time is limited.
When we talk about trade wars as if they were something new, we make a diagnosis mistake. We’ve been in a trade war for years. The United States has been denouncing trade barriers imposed by China and other countries directly and indirectly for years, with a World Trade Organization that did nothing about it.

The United States acted in the wrong way, and between 2009 and 2016 introduced more protectionist measures than any other G-20 country. The World Trade Organization warned on several occasions before the Trump administration took office of the increase in protectionism since 2011.

China desperately needs to keep the trade surplus with the United States to maintain its extremely indebted growth model. More than the United States needs China to purchase its debt.
China is not the main holder of US bonds (not even the largest foreign buyer). The largest holders are North American institutions and investors in their vast majority.

The United States has seen demand for its bonds remain robust and yields have not soared even with China and the Fed selling. Meanwhile, China’s foreign exchange reserves have fallen.
China’s foreign currency reserves fell to the lowest level in 18 months in October. A reduction of $ 33.9 billion in October, the worst since December 2016 and the lowest level since April 2017.

China cannot maintain its growth – based on a huge debt bubble – if its exports to the US fall. There is no other market that can offset its exports to North America. And its trade surplus with the United States is already over 275 billion dollars per year, the biggest contributor to the Chinese GDP from the external sector.
A drop in the growth of China’s exports would mean a much larger collapse of its foreign exchange reserves, which are down 30% since the 2014 highs.
A collapse in foreign exchange reserves also accentuates the already existing capital flights, which in turn would lead to more capital controls and, with it, three effects. Lower growth, an increase in the already high debt and the risk of a very important devaluation of the yuan.
These three effects have already happened in 2018.
In summary, for China, the trade war is devastating. For the US it is negative, but for China it is a disaster.
The United States exports very little (11% of GDP), so any threat that leads to an agreement is good.
A trade war can generate higher costs of goods and services for Americans, but the reality is that China exports disinflation and, if any, inflation expectations are falling, not rising.
This does not mean I support trade wars. It means that the idea that both sides are equally negatively impacted is simply empirically incorrect.
As such, the agreement announced between the US and China in the G20 is nothing more than a “conditional ceasefire”.
China has little intention of guaranteeing intellectual property and eliminating capital controls or the immense interference between political and legal power.
The increase in purchases from China to the United States announced is likely to have a very low impact on the trade surplus . China’s trade surplus with the US has skyrocketed in 2018 from 21.9 billion dollars in January to 34.1 billion in September. If China doubles its purchases of agricultural and energy products from the United States, something very difficult to achieve, this surplus would only fall by a maximum figure of 3 billion US dollars.
This agreement is only a pause, and the announced tariffs would be recovered if improvements are not evident. The tariffs announced for January 1st would be increased to 25% if China does not comply in 90 days.
The differences in the interpretation of the agreement between the Chinese and US administrations can be seen in their official statements.
While the US says that China will change its policy with respect to intellectual property, capital control and legal security, China only says that they “will work together”. While the US states that the agreement is invalidated after 90 days, China does not mention the deadline. While the US mentions that the purchases of North American products will increase in specific sectors, China only talks about buying more products.
This agreement does not change the trade and policy differences of both countries, but it is very similar to the failed agreement reached with China in May that ended in nothing. We have to be very cautious and wait to see if real economic data improves. If China continues to devalue the Yuan and inject capital into its financial and corporate sectors it will be a sign that the agreement has no credibility for the Chinese government itself. Furthermore, as leading indicators show, the global slowdown is much deeper and complex than the differences between China and the US on trade. If the global economy recovered the trade growth levels of 201, global GDP slowdown would still be evident, and more pronounced than consensus currently estimates.
This trade deal is not only vague, conditional and temporary… It does not disguise the slowdown of major economies, which had nothing to do with trade wars and a lot to do with debt saturation.
Be careful thinking that this is a catalyst that puts the world back in growth and multiple expansion modes. The reality is that this deal is not a catalyst for the global economy.
In this chat at IG TV we discuss the outlook for copper and other base metals.

Oil prices surged into the third quarter due to a combination of factors:
Now we are seeing an obvious “hangover” effect, similar to what we saw in 2008.
If you remember, in 2008 we saw oil prices rise dramatically despite global growth estimates coming down and evidence of rising risks to the global economy. We might not be in a similar situation to 2008, but we are seeing a clear evidence of a slowdown.
Moody’s has slashed its estimates of global growth for 2019 by 10% in the past three months, to 3%. Meanwhile, crude inventories are likely to rise in the next months as the main importers start to show the reality of lower growth.
The US has reached an all-time record in oil production, 11.6 million barrels per day, and expected to reach 12 million barrels per day in the next two years, surpassing Russia and Saudi Arabia as the world’s largest producer.
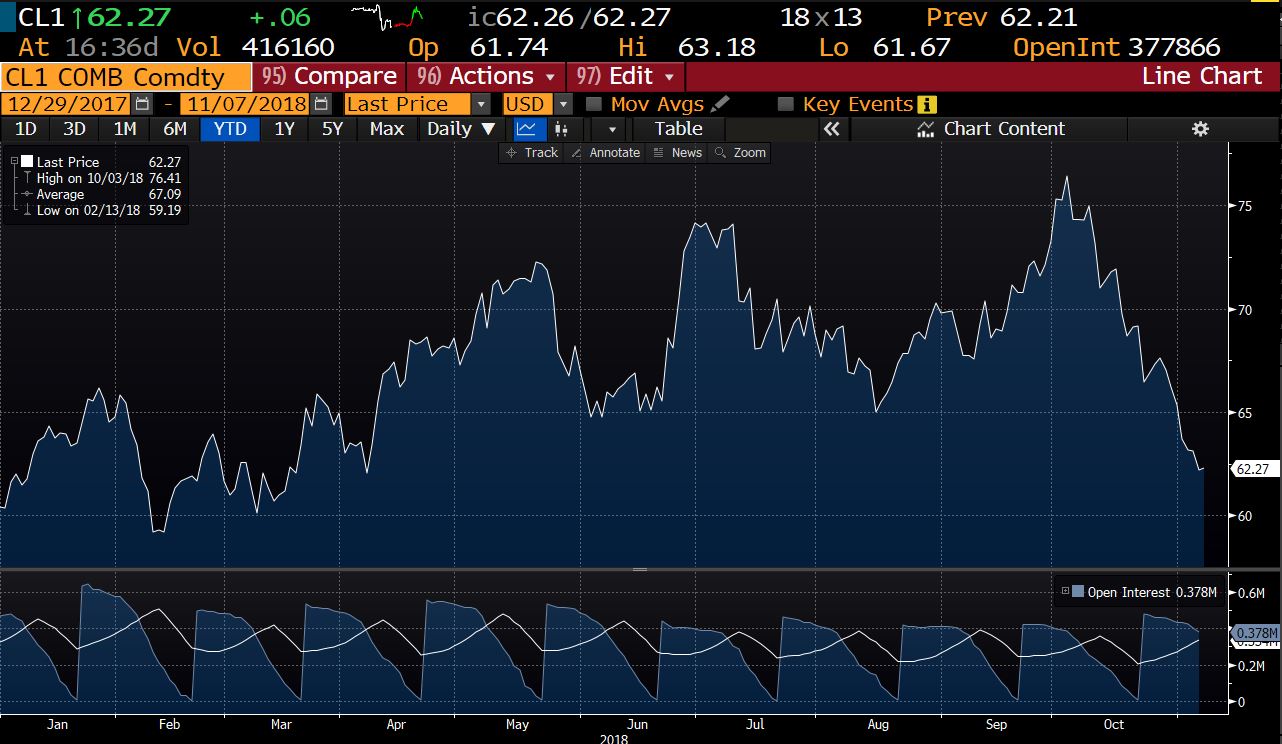
As such, oil prices have roundtripped despite OPEC keeping the tight grip on supply, and also despite concerns on Venezuela and Iran output.
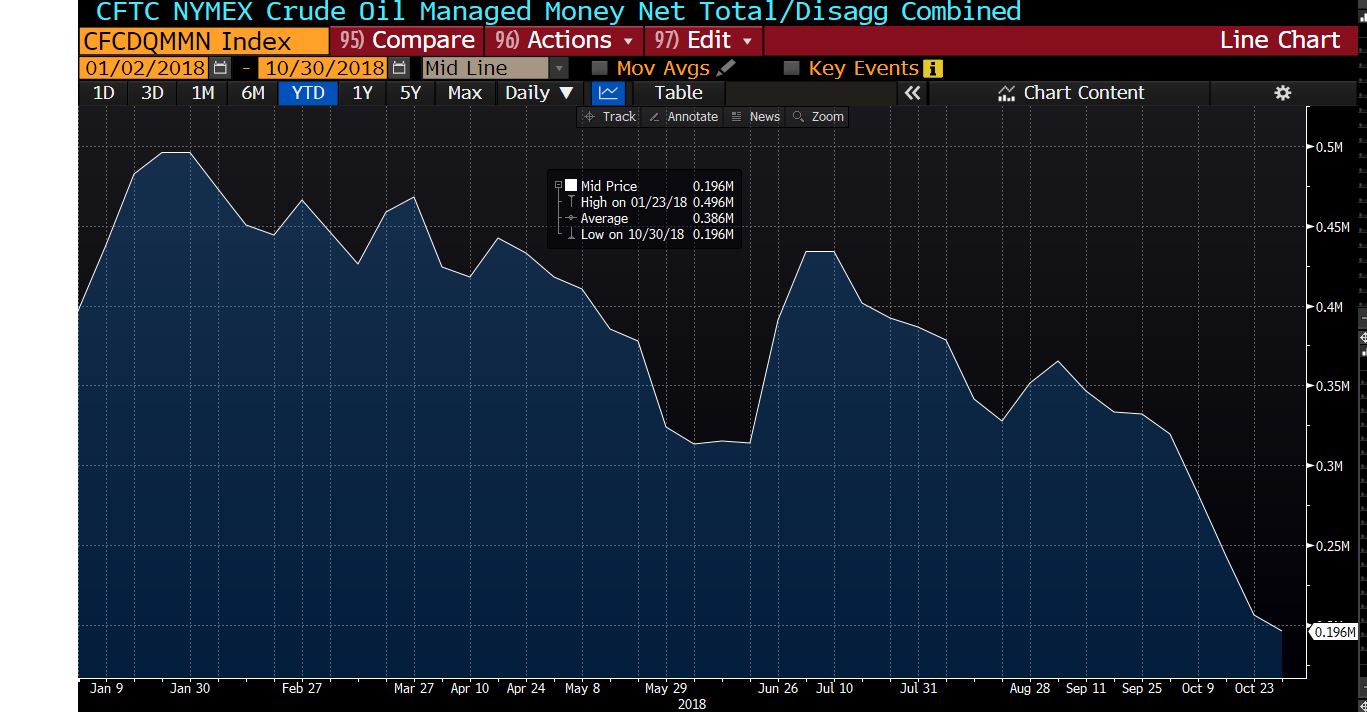
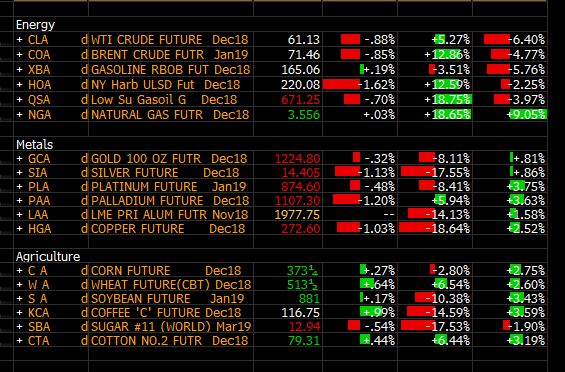
Not only short-term prices are down on the year, but the entire long-term curve has shifted down.
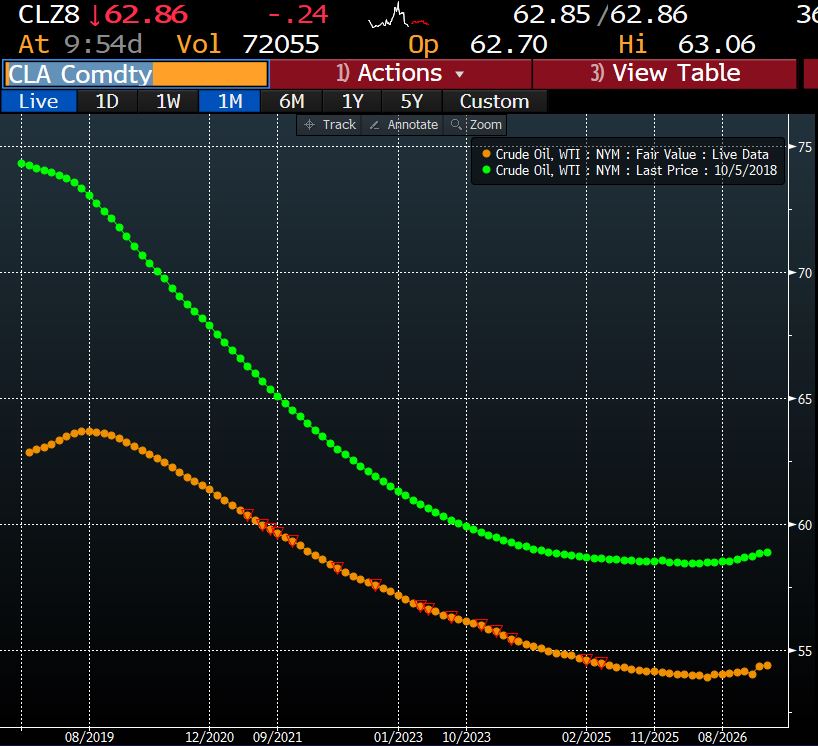
We are talking an entire $5 move down in the forward curve, and oil is now in contango, after spending a few months in backwardation.
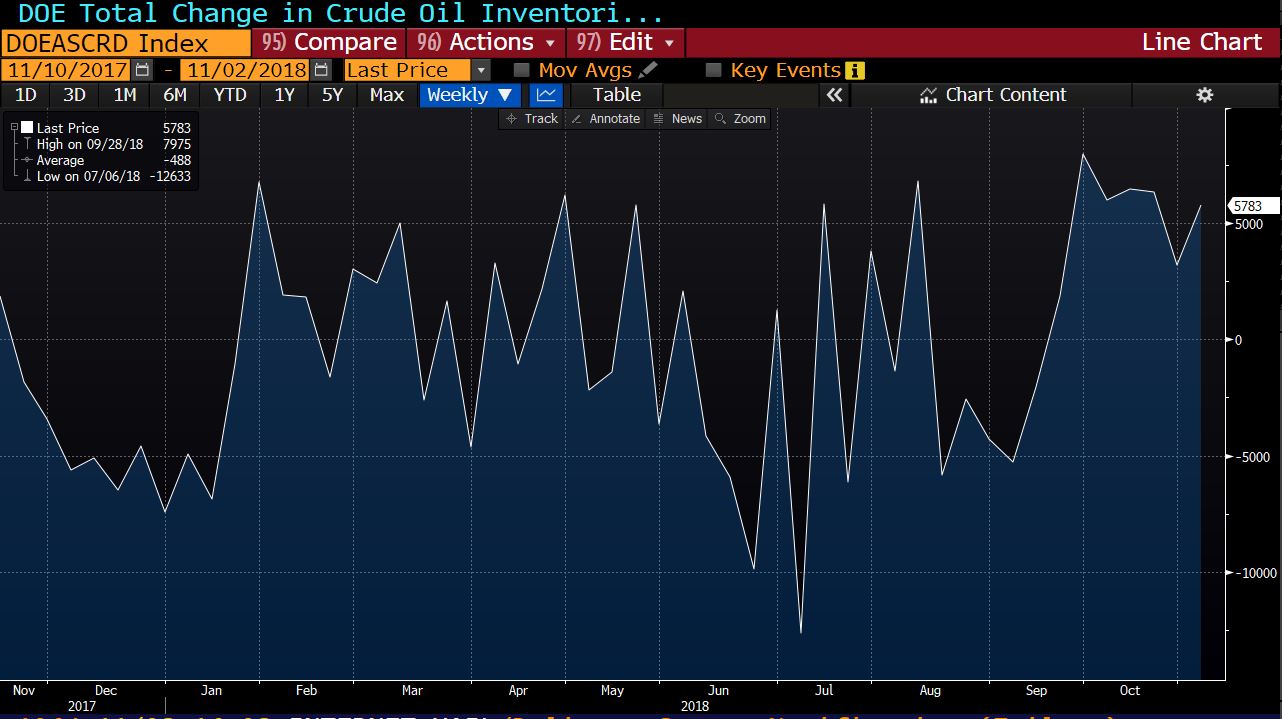
Inventories, which fell between April and September, are back at high levels.
The move in oil is simply another piece of evidence of the global slowdown that had been reflected in the price of copper and other commodities. More disinflationary risk as Chinese data becomes more concerning and the eurozone, as well as emerging markets, publish weaker-than-expected figures.
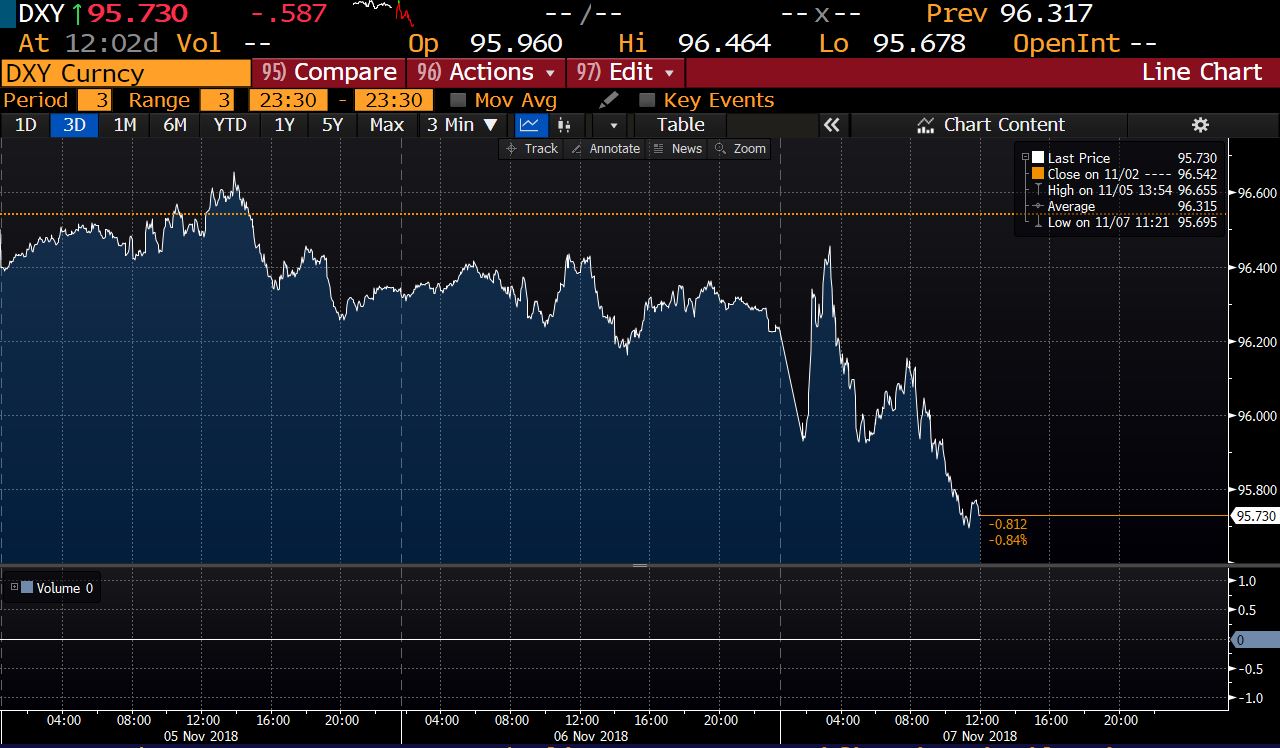
We cannot blame the US dollar, because oil prices have been falling without any rise in the DXY (dollar index).
OPEC has kept its supply cuts, so there is very little else they can do. More importantly, if they decide to artificially manipulate supply again, the response from consumers will be more diversification and it will be -again- only to the advantage of the US producers.
Furthermore, if OPEC remains fixated in inflating oil prices, they will simply hurt their customers in a weakening global growth environment.
What oil prices are showing is simply that we were living a mirage of bullish estimates and artificial inflation of prices, and it lasted very little.
If you want to be bullish oil from here you need to believe in three things:
. OPEC greed (probable)
. Global demand growth rising (improbable)
. Rates falling and leveraged bets increasing (unlikely)
The reflation trade never existed. It was simply part of the fallacy of synchronized growth, and it is dissipating alongside the central-planned myth of GDP growth by design.
We have been reading numerous comments recently about a forthcoming recession and the next crisis, particularly on the tenth anniversary of the collapse of Lehman Brothers.
The question is not whether there will be a crisis, but when. In the past fifty years, we have seen more than eight global crises and many more local ones, so the likelihood of another one is quite high. Not just because of the years passed since the 2007 crisis, but because the factors that drive a global crisis are all lining up.
What drives a financial crisis? Three factors.
What are the main factors that could trigger the next financial crisis?
The fallacy of synchronized growth triggered the beginning of what could lead to the next recession. A generalized belief that monetary policy had been very effective, growth was robust and generalized, and debt increases where just a collateral damage but not a global concern. And with the fallacy of synchronised growth came the excess complacency and the acceleration of imbalances. The 2007 crisis erupted because in 2005 and 2006 even the most prudent investors gave up and surrendered to the rising-market beta chase. In 2017 it was accelerated by the incorrect belief that emerging markets were fine because their stocks and bonds were soaring despite the Federal reserve normalization.
What will the next crisis look like?
Nothing like the last one, in my opinion. Contagion is much more difficult because there have been some lessons learnt from the Lehman crisis. There are stronger mechanisms to avoid a widespread domino effect in the banking system.
When the biggest bubble is sovereign debt the crisis we face is not one of the massive financial market losses and real economy contagion, but a slow fall in asset prices, as we are seeing, and global stagnation.
The next crisis is not likely to be another Lehman, but another Japan, a widespread zombification of global economies to avoid the pain of a large re-pricing of sovereign bonds, that leads to massive tax hikes to pay the rising interests, economic recession and unemployment.
The risks are obviously difficult to analyse because the world entered into the biggest monetary experiment in history with no understanding of the side effects and real risks attached. Governments and central banks saw rising markets above fundamental levels and record levels of debt as collateral damages, small but acceptable problems in the quest for a synchronised growth that was never going to happen.
The next crisis, like the 2007-08 one, will be blamed on a symptom (Lehman in that case), not the real cause (aggressive monetary policy incentivising risk-taking and penalising prudence). The next crisis, however, will find central banks with almost no real tools to disguise structural problems with liquidity, and no fiscal space in a world where most economies are running fiscal deficits for the tenth consecutive year and global debt is at all-time highs.
When will it happen? We do not know, but if the warning signs of 2018 are not taken seriously, it will likely occur earlier than expected. But the governments and central banks will not blame themselves, they will present themselves -again- as the solution.
![]()
© 2024 Alpha Strategy Consulting. Privacy Statement